Autonomously researching granular market dynamics on Hyperliquid
Most participants lose in the market. Most modern platforms support private trading, so the few anonymous power users who win big stay shrouded. Who they are matters as much as how they win. Hyperliquid, a perpetual-futures venue built on its own blockchain, publishes every transaction: every order, every fill, every liquidation, each attributed on-chain to an account. There is no hidden privileged data feed. That makes it uniquely legible to machines — the ideal surface for an agent to find winners, study them, and backtest in full. So we pointed our autonomous research system at 365 days, \(\$5.95\text{T}\), of volume comprising trades from ~825,000 addresses. We asked the age-old question Who makes money, and how? What follows is: the shape of the population, the strategies that actually win, those that only look like they win, and the conditions that separate them. Money flows from transients, to persistent traders, to the exchange. The house is the only group that always wins.
The research system treats each wallet as a unique account and walks every wallet's fill by fill to reconstruct per-account, per-day aggregates, before clustering them on how they trade rather than how they did. Every claim has to clear three adversarial checks: an open-position mark, so a wallet sitting on hidden losses can't pass as a winner; a stated null hypothesis to beat, so that lucky wallets aren't counted among successful strategies; and an out-of-sample split. Several of the system's own tidiest stories were refuted by its follow-up checks.
One measurement choice governs everything below: the spine is realized profit, closed-trade PnL minus fees. Open-position PnL and funding are handled separately, and an address is an account, not a person. Summed across all 825,000 addresses, gross realized PnL is just \(+\$84\text{M}\) on \(\$5.95\text{T}\) of volume, 1.4 bps from zero. It is not exactly zero only because a year is a finite slice of an ongoing market: positions already open at the start, and still open at the end, leave a tiny boundary residual rather than real edge. That near-zero total is what licenses the first finding.
Of the 824,945 addresses that ever traded a perp, only 23.4% are profitable over their lifetime. The population's aggregate net result is \(-\$786\text{M}\), and because the market is essentially zero-sum before costs, that loss is almost exactly the fee bill:
\[ -\$786\text{M} \;\approx\; \underbrace{+\$84\text{M}}_{\text{gross PnL}} \;-\; \underbrace{\$870\text{M}}_{\text{fees}} \]
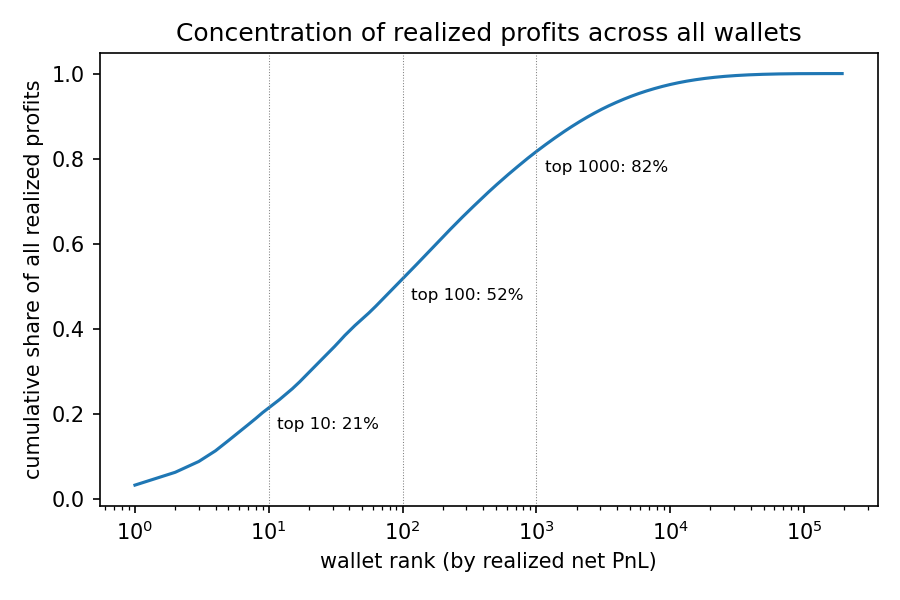
The crowd isn't being outplayed, it's losing for playing. Like a casino, what profit does exist is extraordinarily concentrated: of the 824,945 wallets, the top 10 most profitable take 21.5% of all gross profit, the top 100 take 51.8%, the top 1,000 take 81.7%. Persistence is what separates the donors from the regulars: the 57,092 wallets with at least 20 active days and \(\$1\text{M}\) of lifetime volume lose only \(-\$158\text{M}\) in aggregate, while the 768,000 small or short-lived accounts lose \(\$628\text{M}\). Most of the money extracted from this market comes from a long tail of transient accounts. Persistence looks like the differentiator — but persistence and skill are not the same thing. So is persistence the cause, or just a symptom?
Splitting the zero-sum identity across the two groups makes the flow of funds explicit. The transient tail pays only \(\$110\text{M}\) of its \(\$628\text{M}\) loss in fees; the other \(\$518\text{M}\) is a straight transfer to the persistent traders. The persistent group is thus up \(\$602\text{M}\) gross against the tail, pays \(\$760\text{M}\) in fees, and nets \(-\$158\text{M}\). Money flows from transients, to persistent traders, to the exchange. The house is the only group that always wins.
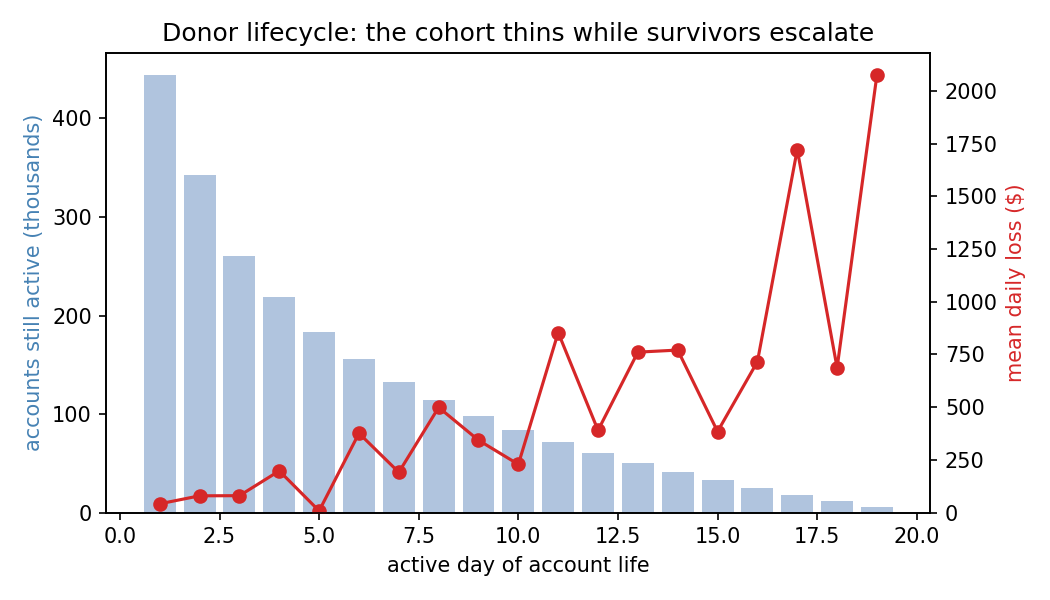
Of the 444,000 tail accounts, the median active day loses a near-constant \(\$0.70\) — the same on day one as on day fifty. But among those who stay, the stakes escalate: mean daily losses grow from \(-\$42\) on the first active day to \(-\$854\) by the eleventh, as survivors take bigger swings. Some accounts grind to zero slowly. Most don't. Liquidation roughly doubles the exit rate — 30% of liquidation days are an account's last, versus 16% otherwise — and 46% of all lifetime losses among losing tail accounts are realized on their final active day. When the donor account loses big, they don't come back.
Clustering the 57,092 persistently active wallets on ten behavior-only features (volume, fill intensity, fill size, maker share, liquidation share, activity regularity, fee rate, coin concentration, builder-venue share, coin count, and nothing about outcomes) yields a clean read on what trading approach actually earns:
| Cluster | Wallets | Net PnL | % prof. | Med. vol. | Fills/day | Maker |
|---|---|---|---|---|---|---|
| High-frequency firms | 6,806 | +$310M | 32% | $118M | 308 | 0.13 |
| Passive makers | 4,869 | +$41M | 41% | $5.0M | 57 | 0.74 |
| Diversified grinders | 8,875 | −$21M | 22% | $3.9M | 52 | 0.03 |
| Builder-venue users | 5,132 | −$24M | 32% | $4.1M | 80 | 0.30 |
| Pure takers | 5,243 | −$53M | 10% | $2.4M | 22 | 0.00 |
| Single-market specialists | 9,238 | −$55M | 19% | $4.2M | 24 | 0.05 |
| Generic actives | 14,715 | −$141M | 24% | $3.4M | 28 | 0.06 |
| Liquidation-prone | 2,214 | −$214M | 9% | $2.9M | 17 | 0.03 |
Behavioral clusters sorted by aggregate net realized PnL. Only the top two are net positive. "% prof." is the share of wallets profitable over their lifetime; "Maker" is median maker share.
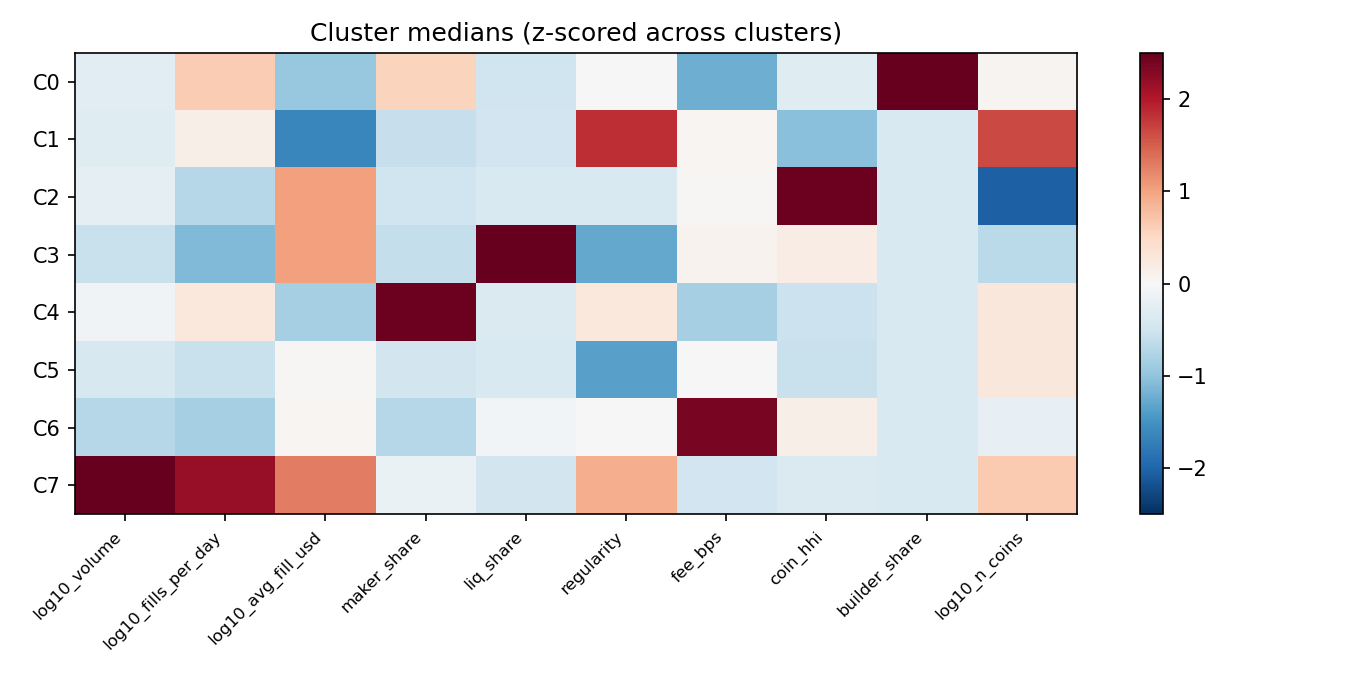
Three things survive scrutiny. First, only two of the eight approaches are net positive: high-frequency traders and passive makers. Every taker-styled, concentrated, or casual profile loses in aggregate, worst of all being the liquidation-prone cluster, which loses \(-\$214\text{M}\) from just 2,214 wallets. Second, even the winning approaches are mostly losers: inside the high-frequency cluster only 32% of wallets are profitable, and the median member loses \(\$42\text{k}\). The cluster's \(+\$310\text{M}\) is its top 50 wallets earning \(+\$1.64\text{B}\) net while the other ~6,750 members lose about \(\$1.3\text{B}\). Trading like a high-frequency firm does not pay; only being the best does. Third, the top winners' edges (around 156 bps of volume) are far too large for market-making rebates alone, which points at what they are really doing.
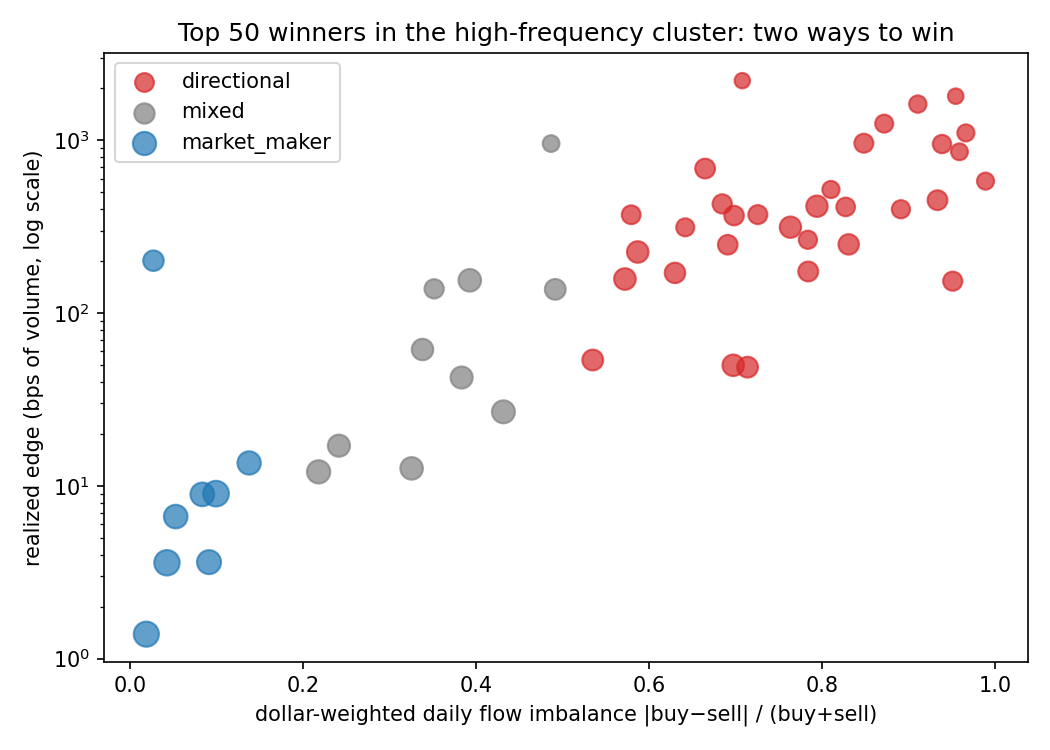
Decomposing the top 50 winners by how balanced their daily flow is (a market maker buys and sells in near-balance every day; a position trader's days are one-sided) splits the elite cleanly:
| Style | Wallets | Net PnL | Volume | Med. edge | Med. maker |
|---|---|---|---|---|---|
| Directional position-takers | 32 | +$1,095M | $38B | 385 bps | 0.15 |
| Mixed | 10 | +$296M | $61B | 52 bps | 0.37 |
| Market makers | 8 | +$249M | $371B | 7.8 bps | 0.81 |
The top 50 winners of the high-frequency cluster, by daily flow balance.
Two-thirds of the elite profit pool is directional: 32 wallets earning a median 385 bps of volume on one-sided days, with low maker share. They are high-frequency in fill count but position traders in economics. True spread-capture market making is the minority of elite profit (8 wallets, \(+\$249\text{M}\) at 7.8 bps) while supplying ten times the volume. So the two ways to win are: be paid for presence, or hold a conviction longer than anyone else can. Everything in the strategy dossiers is one of these two with different machinery bolted on.
Each wallet below passed an open-position mark, so the profits are real rather than deferred losses.
The new-listing short specialist · +$140M
The single biggest winner on the exchange. 1.34M fills over 319 days, 89% aggressive, median order around \(\$2.5\text{k}\), which is execution slicing, not blocks. Its profit is a list of post-listing collapses: one 2025 listing alone was worth \(+\$52\text{M}\). The wallet took a short position at launch and had the worst day of its life, \(-\$25\text{M}\). It waited out the launch pump, took the pain, and made multiples back as the coin fell apart.
The hybrid maker-sniper · +$128M
71% of its 3.6M fills are passive, yet the aggressive flow earns more: \(+\$72\text{M}\) from only \(\$1.35\text{B}\) of taker volume — 53 bps per dollar — against \(+\$56\text{M}\) from ten times as much maker flow. It quotes small two-sided clips all day and strikes directionally when its signal fires, holding a persistently short-tilted book. Its worst day across a full year and \(\$8.3\text{B}\) of volume was \(-\$3.5\text{M}\): an extraordinarily tight left tail.
The canonical market maker · +$108M
The purest maker: 44M fills, active all 365 days of the year, daily buy/sell balance near zero on every day, and negative lifetime fees, because it is paid rebates rather than charged. The striking detail is that liquidation-flagged fills carry \(+\$51\text{M}\), nearly half its lifetime profit, on just \(\$2.3\text{B}\) of notional. Half the business is absorbing forced selling at cascade prices.
The passive block swing whale · +$47M
One asset, one direction at a time, and never in a hurry. It builds positions through massive resting limit orders — \(\$1.1\text{M}\) median, 92% maker rate — letting counterparty flow fill it in over days rather than minutes, then unwinds the same way. It never chases price. The edge is patience and size: by the time the position is fully on, the market has already moved to meet it.
The small-cap campaign short · +$72M
Short across hundreds of low-cap coins at once. It has no entry trigger, rests its orders at the touch rather than deep in the book, and simply sells weak coins that keep sliding. By dollar value, two-thirds of its open positions are held for more than a week, and over half its lifetime profit (\(+\$38.9\text{M}\)) was made on October 10 alone.
The cascade-day event specialist · +$35M
Active only 40 days all year, and \(+\$33.9\text{M}\) of its \(+\$34.9\text{M}\) lifetime profit came on a single day, October 10, churning \(\$1.59\text{B}\) across 168 coins, flat by the end of the day. It buys dislocations and sells the recovery intraday, then goes dormant until the next event.
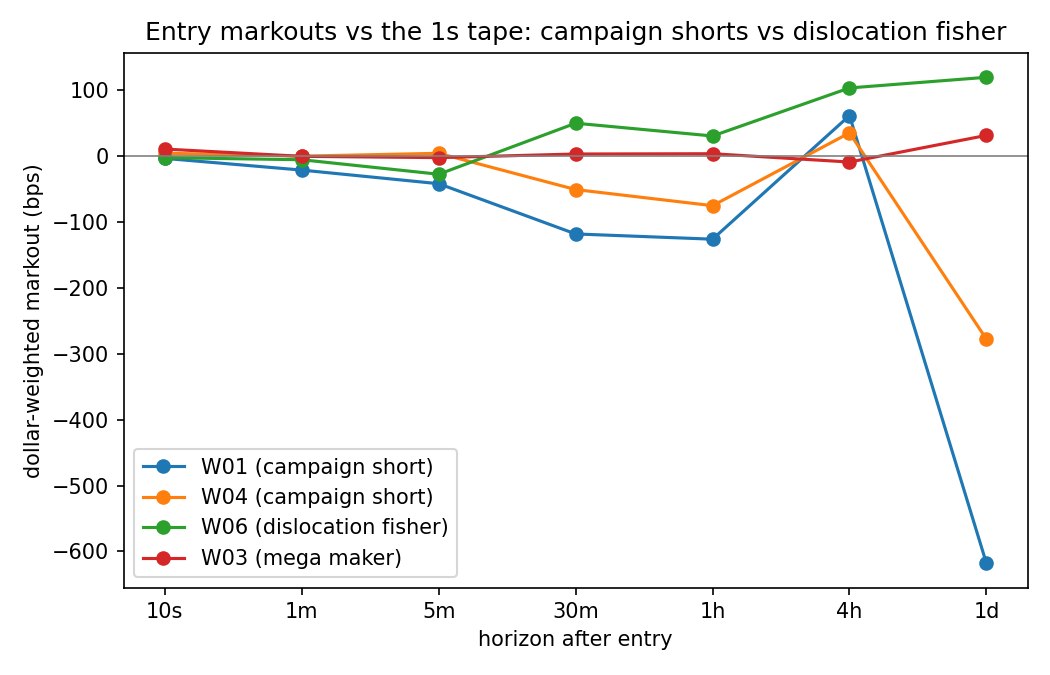
Marking each archetype's entries against the second-by-second tape shows they run on completely different clocks, and it overturns the intuitive story about the big directional winners. They have no short-horizon timing edge at all: their entries are coin-flips at every horizon out to a day, and on their heaviest days they are deeply underwater at first, because they short into pumps that keep pumping. The maker, by contrast, is paid within ten seconds of a passive fill and flat beyond a minute. So the edge of the campaign trader is not when it enters but where the campaign ends: new listings systematically collapse, weak coins bleed, and the operator sizes the thesis, withstands \(-\$25\text{M}\) days, and exits over weeks. The moat is conviction plus a balance sheet, not signal latency, which is exactly what should survive on a venue where every fill is public.
Two mechanisms pay them to wait. Funding carry: shorts in overheated perps collect funding while they hold, enough that the biggest winner's ETH book earned an estimated \(+\$13.5\text{M}\) in funding alone. And the risk engine: between 20% and 40% of the directional elite's lifetime profit is realized for them by the exchange force-closing their deeply-winning shorts at cascade bottoms, a better exit than any order they could have placed. No one needs to time the bottom. The venue's own machinery does it.
Forced liquidations are where the donors' losses are realized, so we expected a class of predators built to hunt them. There isn't one. In a 27-hour sample, 100% of the fills that absorb liquidated flow are passive resting orders. No aggressive "liquidation hunters" exist; forced selling simply sweeps the resting book, and the wallets on the other side are the same market makers from the winning cluster. Absorbing forced flow is a perk of quoting, not a strategy. Even the protocol's own backstop vaults, active all 365 days with tens of billions of volume, roughly break even. The backstop is a utility, not a profit center.
The median day moves \(\$27\text{M}\) between wallets. October 10, 2025, the largest liquidation cascade in the sample, moved \(\$1.18\text{B}\) in a single day, which is 8.8% of the year's total, \(8.6\times\) the second-largest day and \(43\times\) the median. That day 60,441 wallets lost \(\$1.50\text{B}\) (median lost \(-\$125\)), and the top 100 winning wallets took 77% of the transfer. This is why every elite archetype's best day is the same date: the crowd loses big and whoever is structurally positioned collects years of edge in hours. The top 20 days account for a quarter of the entire year's wealth transfer.
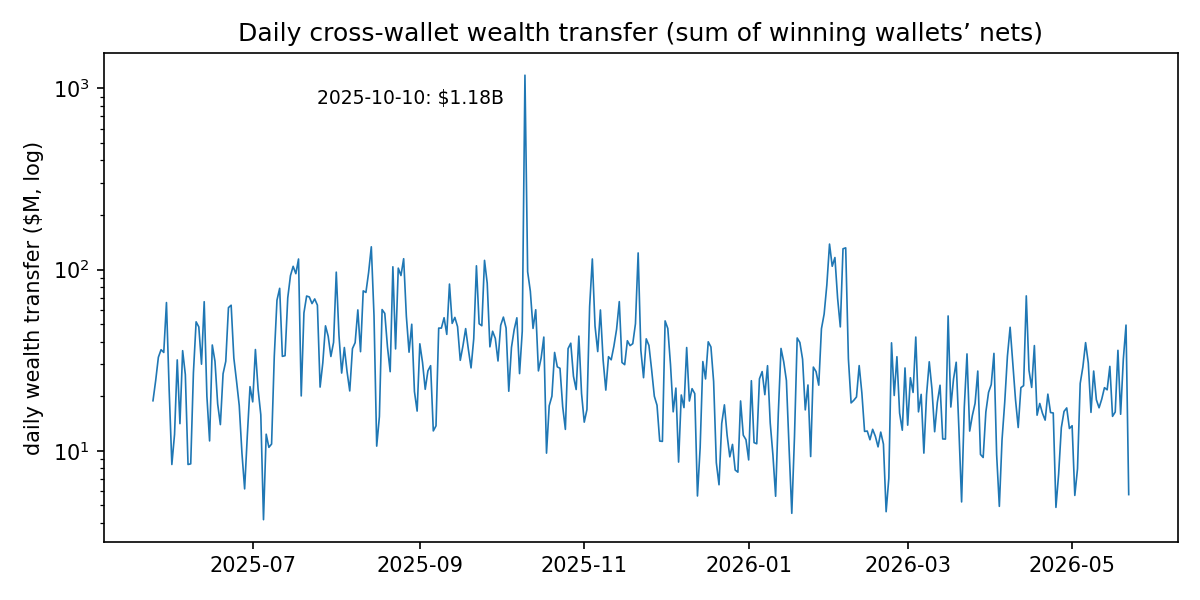
Skill on these days repeats. Wallets that won at least \(\$100\text{k}\) on the great cascade are 63% profitable across the other big event days, double the 31% base rate. But fortune does not: the single largest winner of October 10, up \(\$81\text{M}\) that day, was a 33-day-old account born the day before the cascade. Three months later it lost \(\$212\text{M}\) in one day and never traded again, finishing as the single biggest lifetime loser on the exchange. Event skill persists for the many; event fortunes mean-revert violently for the few who confuse one win with skill.
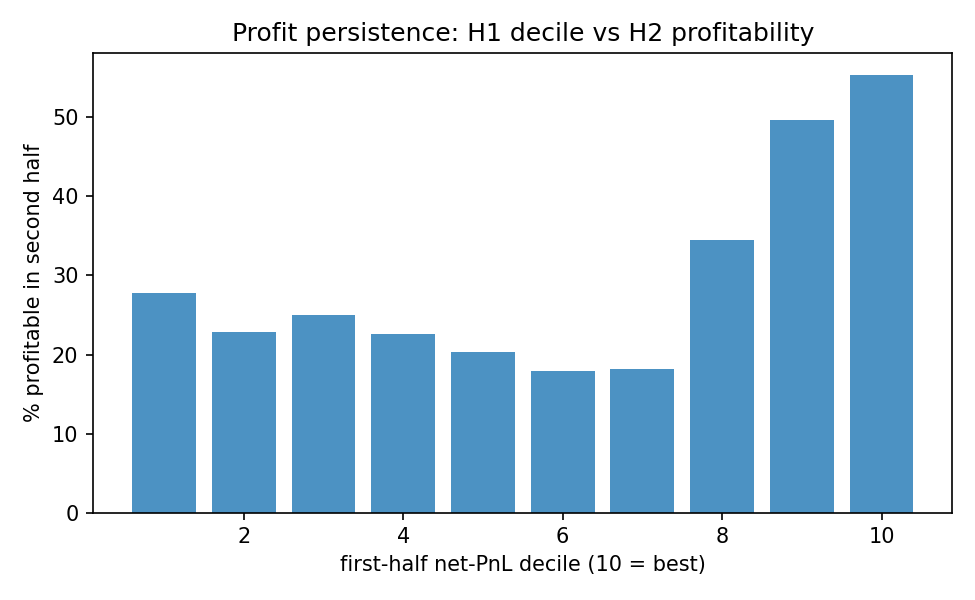
Splitting the year at its midpoint and ranking the 16,825 wallets active in both halves, first-half profit rank predicts second-half rank with Spearman \(\rho = 0.23\) (\(p \approx 10^{-200}\)), and the persistence is strongest exactly where it matters — and only there. The top-100 first-half winners stay 70% profitable in the second half, earning \(+\$393\text{M}\); the top decile stays 55% profitable and the ninth stays 35%. But deciles 1 through 8 are nearly indistinguishable, all clustering between 18% and 28%. Persistence isn't a gradient; it's a step change at the very top. Losing persists too: the bottom decile posts a median \(-\$20\text{k}\) again in the second half. The behavioral classes are stable across both halves as well. This is structure, not the residue of one lucky regime.
One honest caveat: requiring activity in both halves only measures persistence among survivors. This introduces survivorship bias by omitting both the first-half winners who voluntarily cashed out, and the first-half losers who suffered total account depletion — preventing us from knowing if those terminal losers were structurally unskilled or simply lacked the capital to survive a period of bad luck.
Just as much of the value is in what the system looked for and could not find. Several strategies do not exist at scale on this venue. There is no standalone liquidator class (absorption is passive market making). There is no copy-trading crowd, even though every fill is public in real time: testing all flow around the biggest winner's entries, the crowd follows price, not fills. There are virtually no on-venue carry farmers (screening every wallet for the long-spot, short-perp signature turns up two small accounts). And there are no smooth tail-sellers quietly compounding toward a blowup: every abnormally smooth equity curve belongs to a high-frequency trader, where smoothness is the law of large numbers, not a hidden martingale. The absence of these strategies is what makes the positive findings credible — the market is not hiding easy money.
Four conditions describe essentially every durable winner.
Everything else we tested — copying the visible fills of the best wallets, hunting liquidations, farming carry, grinding high win-rate streaks — none of it pays. The market pays for liquidity, conviction, presence at the extremes, and discipline. It pays for nothing else. None of these dynamics are unique to crypto. It is the basic arithmetic of who wins in any market, and Hyperliquid is simply the first place we could watch all of it at once.